When NOT to Trust an NDVI Map: 8 Situations That Fool Satellite Crop Monitoring
Every measurement tool has failure modes, and knowing them is the difference between using a tool and being used by it. NDVI is a remarkably robust indicator of vegetation vigor, but there are well-documented situations where the map says one thing and the field says another. Here are the eight that matter most in practice, and how to recognize each before it costs you a wrong decision.
1. Bare soil and early growth stages
Before the crop canopy covers roughly 30% of the ground, the satellite mostly sees soil, and different soils have different NDVI baselines. Dark, moist soil reads higher than dry, light-colored soil — so after rain, bare zones can look like they gained vegetation. In the first weeks after sowing, treat NDVI as a stand-establishment check (did the crop emerge evenly?) rather than a health measure, and never compare early-stage NDVI across fields with different soil colors.
2. Saturation in dense canopies
Above a leaf area index of about 3–4 — a fully closed wheat, rice, or maize canopy — NDVI stops responding. The formula's red-light term is already near zero, so adding more biomass changes almost nothing. Two maize fields at 0.85 and 0.88 are effectively indistinguishable, and a top-performing zone cannot be told from a merely good one at peak season. The practical consequence: make your comparisons in the mid-vegetative window, when the index is still sensitive, not at peak canopy.
3. Cloud shadows masquerading as stress
A cloud outside your field can cast a shadow inside it. Shadowed crop reads dramatically lower NDVI — a convincing fake stress zone. The tell: it appears on exactly one date and is gone on the next pass, often with a soft-edged, elongated shape. Compare another date if available, but do not postpone a needed field inspection.
4. Weeds read as healthy crop
NDVI measures green photosynthesizing matter — any green matter. A weedy fallow strip, a flush of grass after rain, or a heavily infested corner all produce beautifully high NDVI. If a zone reads suspiciously vigorous compared to its history, or a "crop" appears where you have not sown one, think weeds. This is also why NDVI alone cannot verify crop type or crop presence for auditing purposes without ground checks.
5. Standing water and waterlogging
Open water strongly absorbs near-infrared light, dragging NDVI toward zero or negative. In flood-irrigated systems and rice paddies this is routine and expected. But partial waterlogging is trickier: a thin water layer under a canopy lowers the reading somewhat, so a waterlogged zone can look like mild vegetation stress before the crop actually suffers. If a low zone coincides with your field's lowest ground after heavy rain, suspect water before nutrients.
6. Mixed pixels at field edges
Every boundary pixel averages your crop with whatever lies beyond it: road, canal, trees, the neighbor's differently-managed field. A tree line along the southern edge adds its own vigorous signal; a dirt track drags values down. Always evaluate the interior of the field and mentally discard the outermost pixel ring — on small plots, that ring can be a large share of the total area.
7. Haze, dust and smoke
Atmospheric particles scatter red light more than near-infrared, which typically biases NDVI slightly downward across the whole scene. During residue-burning season or dust storms, a field can appear to have declined 0.05–0.1 with no agronomic change at all. The signature of an atmospheric artifact: everything declined together, including the permanent vegetation (orchards, tree lines) that should be stable.
8. Senescence versus stress
A ripening crop and a dying crop look identical to NDVI: both are losing green leaf area. Late in the season, a declining index is expected and healthy. The information is in the pattern and timing — uniform decline at the crop's normal maturity window is ripening; patchy decline weeks early is a problem. Knowing your crop's calendar is the only way to tell them apart, which is one more reason satellite maps complement rather than replace agronomic knowledge.
A simple reliability checklist
Before acting on any surprising NDVI pattern, run through five questions:
- Does it persist? Compare dates when available, but persistence or disappearance alone does not confirm a cause.
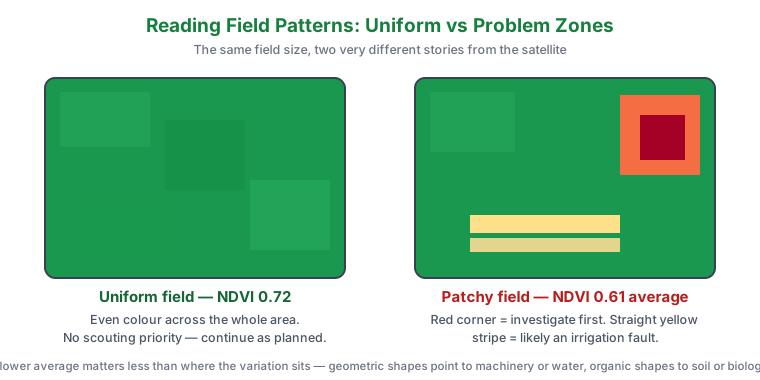
- Does the shape make sense? Geometric shapes follow machinery and water; soft organic shapes follow soil and biology; blob-on-one-date follows clouds.
- What growth stage is the crop in? Check whether soil background (early) or saturation (peak) could dominate the signal.
- What happened in the sky? Rain, dust, burning season, or known cloudy passes around the image date?
- What does the ground say? The final authority is always a pair of boots in the flagged zone.
Why we publish the limitations
A monitoring tool you trust blindly is more dangerous than no tool at all. NDVI has earned its place as the world's most-used vegetation index precisely because its failure modes are known, bounded, and detectable with the checks above. Use the map with these eight caveats in mind and it becomes what it should be: a tireless, honest scout with a few well-understood blind spots.
Interpretation and references
The map is a scouting aid. Displayed summaries are colour-derived estimates; cloud and shadow may remain after scene filtering. Check how ndvi.us works, and use the field checklist to record observations. Examples and suggested workflows are not verified field trials or guarantees of savings.