An NDVI Monitoring Calendar for Rabi and Kharif Crops
Satellite monitoring pays off most when you look at the right moments. Checking your fields randomly wastes the tool; checking at the decision points turns it into an early-warning system. This calendar maps the Sentinel-2 monitoring year onto the Rabi and Kharif cropping seasons of Pakistan and northern India, though the logic transfers to any similar double-cropping system.
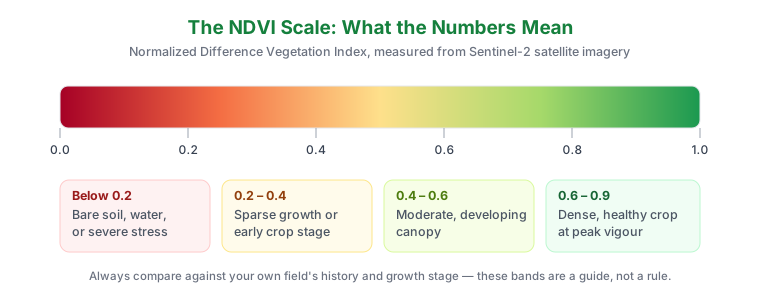
Why timing matters more than frequency
A farmer who checks NDVI once a week all year gets less value than one who checks at six well-chosen moments. That is because NDVI is only decision-relevant in certain windows. During peak canopy the index saturates and tells you little. Over bare soil, the surface background dominates; NDVI is not a direct moisture measurement. But at establishment, at the nitrogen decision point, and at the first sign of terminal stress, one satellite image can change what you do that week.
Rabi season (winter crops)
October – November: sowing and establishment
This is your baseline window. Once the crop has emerged — roughly two to three weeks after sowing — pull an NDVI map. You are not looking for high values; wheat at this stage will read 0.2–0.3 and that is normal. You are looking for evenness. Patches that stayed at bare-soil values while the rest of the field climbed indicate poor germination, seed drill problems, crusting, or waterlogged low spots. Whether replanting or gap-filling is appropriate depends on field evidence, timing and local agronomic advice.
Weather advantage: October and November are typically clear across the Punjab plains, so expect a usable image every 4–5 days.
December – January: the nitrogen decision
The single most valuable check of the Rabi season. As wheat moves through tillering into stem elongation, NDVI climbs steeply, and differences between zones become obvious. A lower-value zone warrants inspection of crop stage, stand, water and soil conditions. NDVI alone does not identify nitrogen deficiency or determine a fertiliser rate.
If nutrient differences are suspected, discuss suitable crop or soil measurements with a local agronomist. Treatment and rate decisions need evidence beyond the colour map.
February: disease and lodging watch
Rust pressure builds in February in many years. NDVI will not identify rust, but a zone declining while neighbouring zones still climb is worth walking immediately. Fog is common this month and will cost you some passes — take the images you get.
March – April: ripening and harvest planning
NDVI declines across the whole field as the crop matures; this is normal senescence. What is informative is the order in which zones decline. Areas that senesce noticeably early are often the driest or shallowest soils, and mapping them across two or three seasons builds a reliable picture of where your field's weak ground is. Save these maps.
Kharif season (monsoon crops)
May – June: pre-monsoon sowing
Cotton and early maize go in. The same establishment logic applies: check two to three weeks after sowing for gaps and uneven stands. Skies are usually clear before the monsoon breaks, so this window is reliable.
July – August: the cloudy stretch
Be realistic — during peak monsoon you may lose two or three weeks of passes to cloud. Do not treat gaps as a fault in the tool. Practical approach: take every clear image you get, and lean on the most recent good map for scouting priorities rather than waiting for a fresh one. If a usable image appears after heavy rain, check specifically for waterlogging patterns in your field's low ground.
September: the recovery check
As the monsoon retreats, clear passes return and crops are in their critical yield-forming stages — rice heading, cotton bolling, maize grain fill. This is the best Kharif window for spotting which zones came through the monsoon well and which are struggling. For rice, interpret readings alongside standing water, canopy cover and the actual crop stage.
October: pre-harvest and season review
Before you clear the field, take a final map and compare it with your establishment map from May. The difference between those two images is the story of your season, and it will inform where you sample soil and how you plan next year's inputs.
A simple annual routine
If you do nothing else, do these five checks:
- Three weeks after each sowing — stand establishment
- At the nitrogen decision point — mid-vegetative, before top-dressing
- After any severe weather event — hail, flood, storm damage documentation
- At peak canopy — a record of the field's best condition
- Before harvest — senescence pattern and season review
Use these as planning prompts, not a complete scouting schedule. Inspection frequency depends on the crop, local conditions and current field reports.
Adapting this to your farm
The dates above suit the Punjab plains. If you farm in Sindh, coastal areas, or at altitude, shift the windows to match your own sowing calendar — the principle is what matters: check at establishment, check before the nitrogen decision, check after weather events, and record the season's end state. Everything else is optional.
Start building your own record this season. Draw your fields on the map once, and each check afterwards takes only a moment.
Interpretation and references
The map is a scouting aid. Displayed summaries are colour-derived estimates; cloud and shadow may remain after scene filtering. Check how ndvi.us works, and use the field checklist to record observations. Examples and suggested workflows are not verified field trials or guarantees of savings.