What Is NDVI? A Farmer's Guide to Reading Satellite Crop Health Maps
If you have ever looked at a satellite crop health map and wondered what the red and green patches actually mean, this guide is for you. NDVI — the Normalized Difference Vegetation Index — is the most widely used scientific measure of plant health from space, and once you understand a few basics, you can use it to choose places for a closer field inspection. It may miss small or early problems.
The idea behind NDVI
Healthy plants do something invisible to our eyes: they reflect an enormous amount of near-infrared (NIR) light. At the same time, the chlorophyll in their leaves absorbs most of the red light that hits them, because red light powers photosynthesis. A stressed, diseased, or water-starved plant does the opposite — it reflects less near-infrared and absorbs less red.
Satellites like the European Space Agency's Sentinel-2 carry cameras that photograph the Earth in both of these wavelengths separately. NDVI simply compares them:
NDVI = (NIR − Red) / (NIR + Red)
The result is always a number between −1 and +1. The more living, actively photosynthesizing green matter a patch of ground contains, the higher the number.
What the values mean in practice
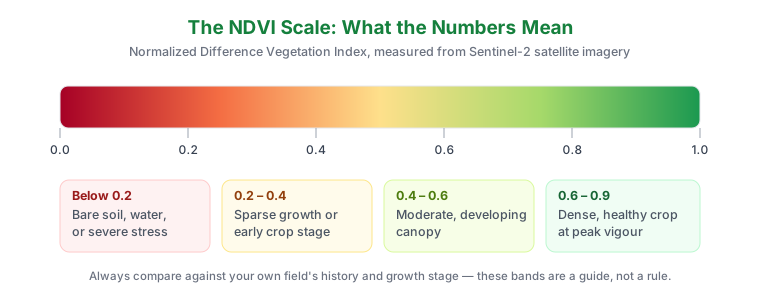
Here is a practical way to read NDVI values for a typical field crop:
- Below 0.1 — bare soil, water, rock, buildings, or harvested stubble. No living vegetation to speak of.
- 0.1 to 0.25 — very sparse vegetation. Early emergence, a failed patch, or severe stress.
- 0.25 to 0.45 — moderate vegetation. Young crops in early growth stages, or mature crops under significant stress.
- 0.45 to 0.65 — good, healthy vegetation. A crop developing normally through its vegetative stages.
- 0.65 to 0.9 — dense, vigorous canopy. A healthy crop at or near peak growth, such as wheat at booting or maize before tasseling.
Two warnings come with any table like this. First, the "right" NDVI depends on the crop's growth stage — an NDVI of 0.3 is perfectly normal for wheat two weeks after sowing but alarming at heading. Second, NDVI is relative: the most useful comparison is not against a universal chart but against the rest of your own field and against the same field on earlier dates.
Why the pattern matters more than the number
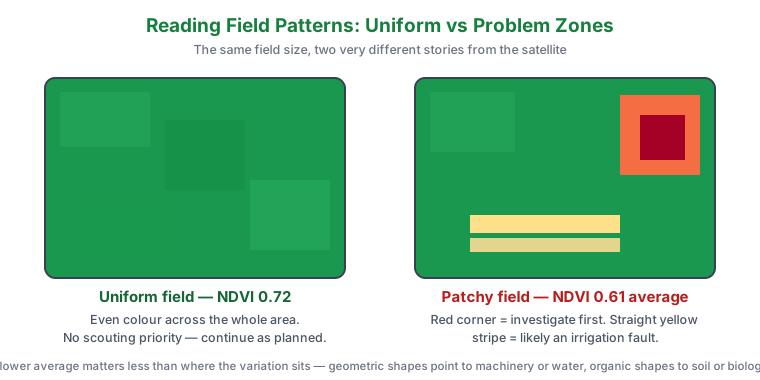
Experienced agronomists rarely fixate on a single NDVI value. What they look for is variation. If 90% of your field reads 0.7 and one corner reads 0.4, that corner is telling you something: a blocked irrigation nozzle, a nitrogen-deficient zone, waterlogging, pest pressure, or a soil texture change. The satellite cannot tell you which of these it is — but it tells you exactly where to walk and look, which can help organise an inspection. No time saving is guaranteed.
This is the core value of NDVI for a working farmer: it is a scouting map, not a diagnosis. It answers "where should I look?" faster and more cheaply than any other tool.
Where the data comes from
The maps on ndvi.us use Sentinel-2 observations from the European Union's Copernicus programme. The red and near-infrared bands have a native 10-meter resolution — meaning each pixel on the map represents a 10 × 10 meter square of your land, about the area of a small courtyard. The Copernicus imagery is available as open data, which is why a tool like this can exist without subscription fees.
How to use an NDVI map, step by step
- Draw your field boundary accurately. NDVI averages are meaningless if your boundary includes the neighbor's field, a road, or a canal.
- Check the image date. Satellite data is not live. A map from six days ago reflects conditions six days ago.
- Look for zones, not pixels. One dark pixel may be noise or a small cloud shadow; a consistent zone deserves checking against image quality and field observations.
- Compare dates. A zone that was green last month and is yellowing now is a developing problem. A zone that has always been weaker may just be different soil.
- Ground-truth it. Walk to the low-NDVI zone and inspect. Match what the satellite sees with what you see: leaf color, moisture, pests, standing water.
Common misunderstandings
"High NDVI means high yield." Usually correlated, but not guaranteed — a field full of vigorous weeds also produces high NDVI. Lodged crops and over-fertilized, all-leaf-no-grain crops can mislead too.
"NDVI works in every season." Over bare soil before emergence or after harvest, soil and residue dominate the observation; NDVI is not a soil-moisture measurement.
"A cloudy image is still usable." It is not. Clouds and shadows can distort readings. Scene-level filtering does not guarantee clear pixels over your field.
The bottom line
NDVI compresses a complex biological reality — photosynthesis across millions of leaves — into a single number per 10-meter square, refreshed every few days, for free. It will not replace your eyes, your experience, or a soil test. But as an early-warning system that never gets tired and covers every acre equally, it has no equal at its price point of zero.
Draw your first field on the ndvi.us map and compare what the satellite sees with what you know about your land — that comparison is where the learning starts.
Interpretation and references
The map is a scouting aid. Displayed summaries are colour-derived estimates; cloud and shadow may remain after scene filtering. Check how ndvi.us works, and use the field checklist to record observations. Examples and suggested workflows are not verified field trials or guarantees of savings.